
Understanding nanoparticle biodistribution in vivo
Nanomedicine is an emerging field that uses nanotechnology for the diagnosis, monitoring, and treatment of biological systems. Nanoparticles (NPs), ranging from 1 to 100 nanometers in size, are being explored as promising tools for drug delivery thanks to their ability to improve therapeutic efficiency, selectivity, and biocompatibility.
Cardiovascular diseases are characterized by increased oxidative stress in the vascular walls, heart, kidneys, and brain. This oxidative damage contributes to inflammation and tissue remodeling, highlighting the need to better understand how therapeutic approaches can interact with biological tissues. Before nanoparticles can be considered for biomedical applications, understanding their distribution throughout the body and their retention in specific organs is essential.
In this project, we want to test a nanomedical approach to protect cells and heart tissue from oxidative stress. The goal of this work was to test a new nanoparticles platform which could be useful for a therapeutic action in heart.
Monitoring nanoparticle distribution over time
18 healthy Sprague-Dawley rats received an intravenous injection of rhodamine-conjugated nanoparticles. Tissue samples from different organs, including the heart, liver, lungs, kidneys, and spleen, were collected at different time points after injection:
- 1 day
- 3 days
- 7 days
- 2 months
The samples were imaged and analyzed using the Alliance Q9 fluorescence imaging system and Alliance Software to detect and quantify nanoparticle-associated fluorescence signals.
This approach allowed researchers to evaluate nanoparticle accumulation and clearance in different tissues over time.
Nanoparticle accumulation in the liver
.webp)
Following intravenous administration, nanoparticles showed increased accumulation in the liver between 3 (c) and 7 (d) days after injection, as demonstrated by the rhodamine fluorescence signal. After 2 months (e), fluorescence intensity returned to a level comparable to control samples, indicating that nanoparticles had been cleared from the liver over time.
Nanoparticle distribution in the heart
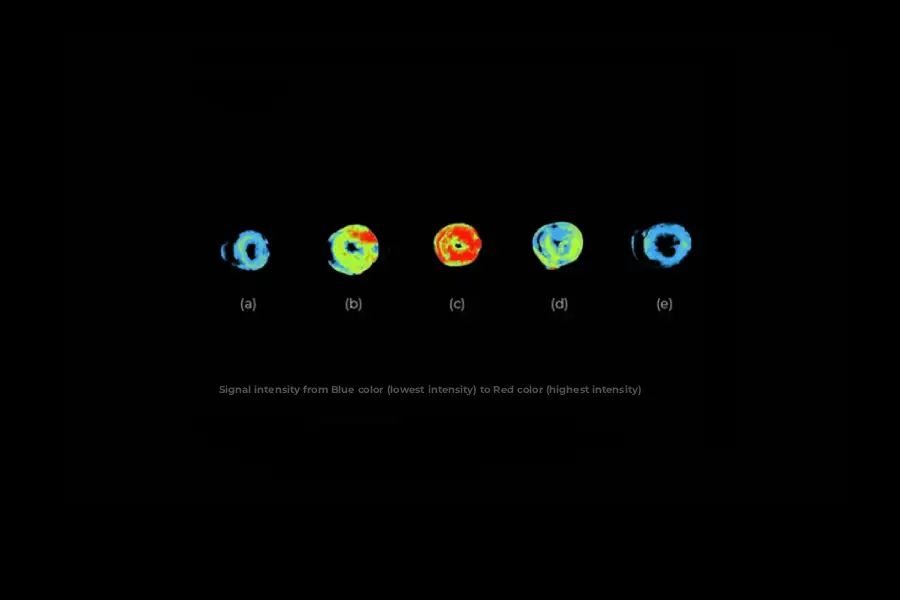
Nanoparticles were detected in the heart shortly after injection, with a strong fluorescence signal observed 1 day (b) after administration. The fluorescence signal gradually decreased from day 3 onwards and approached control levels after 2 months, showing a progressive reduction of nanoparticle presence in cardiac tissue.
Conclusion
The Alliance Chroma fluorescence imaging system enabled researchers to monitor nanoparticle biodistribution and clearance in rat organs with high sensitivity.
By visualizing rhodamine fluorescence in tissue samples, the system provided valuable insights into nanoparticle behavior following intravenous administration, supporting the development of future nanomedical approaches.
1Castellani C, 2Tavano R, 3Campanini F. 1Dept. of Cardiac, Thoracic and Vascular Sciences, 2Dept. of Biomedical Sciences, University of Padua, Italy, 3Eppendorf S.r.l., Milan, Italy

Sales Director